
How To Create Custom Reports in QuickBooks Desktop
Whether you’re using QuickBooks Desktop or QuickBooks Online for your accounting software, experienced users already know that it’s not possible to create a fully custom report in the Intuit application. However, there are various ways that you can use existing report templates to create a more custom QuickBooks bookkeeping or accounting report. The good news is that if you know how to create reports in QuickBooks, creating a customized report will be easy.
Though you cannot create a report from scratch, using these templates will allow you to build a custom report that will suit your needs. For example, if you wish to look at data for the previous year, you can replace the default data with a custom data filter that will create a report based on last years’ activities rather than the default report that covers a single month. In addition to changing data filters, you can also choose to add additional data to any report, as well as add or delete columns and rows, change the format from portrait to landscape, add custom headers or footers, and even include notes on any report that you distribute.
Because of this range of options, you can come as close as possible to create a QuickBooks custom report that is not built from scratch. In addition, any report that you customize can be saved in QuickBooks Desktop for future use or added as a favorite for easy access.
Report customization options are included in all versions of QuickBooks, including QuickBooks Pro, QuickBooks Premier, and QuickBooks Enterprise, QuickBooks Proadvisor, as well as both QuickBooks Online Accountant and QuickBooks Proadvisor.
To start creating custom reports in QuickBooks Desktop, it’ll be helpful to first spend a little time familiarizing yourself with the custom reporting options available in the application. It’s also important to know that QuickBooks is designed to display all of its reports using report sets, which are sets of general instructions specific to each available report. In addition, keep in mind that all QuickBooks Desktop report sets use Source (which is summary information for each transaction) or Targets (which provides detailed information for each transaction) in every default report included in the application, providing you with the structure to build upon when you begin to create a custom report.
Once you’re familiar with the reporting structure, you can begin to explore ways to create more custom reports. But first, you’ll need to access the Report Preferences option in QuickBooks Desktop, where you can set both personal and company preferences for any reports that you’ll be running for any of your companies. Because QuickBooks Desktop reports use report templates, it’s important to set all of your preferences before creating a custom report.
If you’re not sure how to create a custom report in QuickBooks Desktop, we’ll take you through the steps of creating a custom profit & loss report.
It’s also important to know that QuickBooks is designed to display all of its reports using report sets, which are sets of general instructions specific to each available report.
Profit & Loss
QuickBooks Desktop offers a variety of profit & loss reporting options, including a custom summary report, a transaction detail report, a YTD report, and a comparison report. For this example, we’ll say that you’ve been concerned with profit levels for your business. To stay on top of company performance, you decide you’re going to create a detailed profit & loss report for the last two weeks. But if you’re looking to create a more custom profit & loss report, you can follow these steps:
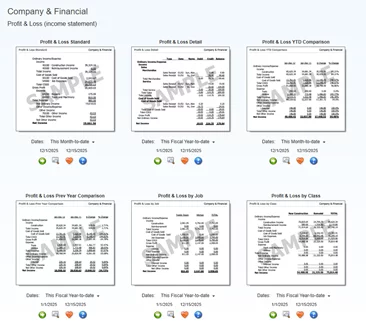
- Choose the profit & loss report you wish to customize. We’re running a detailed profit & loss report in our example, but QuickBooks Desktop offers you several other options to choose from. If you’re unsure which one to choose, click the info button in the report window directly below the report image to find out a bit more about each available report.

The Company & Financial reports page where you can choose the profit & loss report.
- Click on the Customize Report tab at the top of the report. Whatever report you decide to customize in the future, you will need to click on this tab, which is located at the top of any report. Doing so will take you directly to the various available customization options.
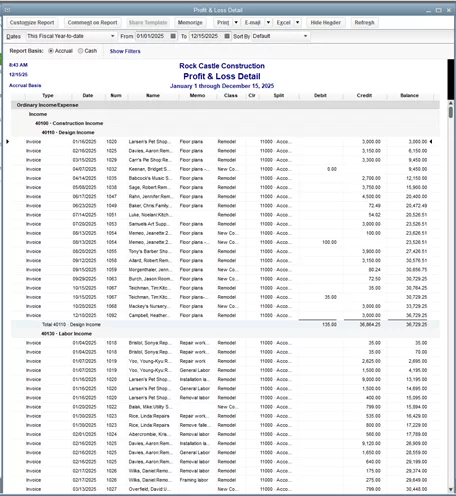
Customize your profit & loss detail report by clicking on the Customize Report option at the top of the screen.
- Clicking on the Customize Report tab will bring up the Modify Report option. This feature offers several different options including the following.
- Display: The Display option lets you choose the date range you wish to include for the report. While the report will always default to the current fiscal year, clicking on the drop-down arrow will display a long list of date range options including a custom option if you don’t see the date range you’re looking for. The Display option also lets you choose both your report basis and the data sort option as well as the number of columns you wish to include in your report.
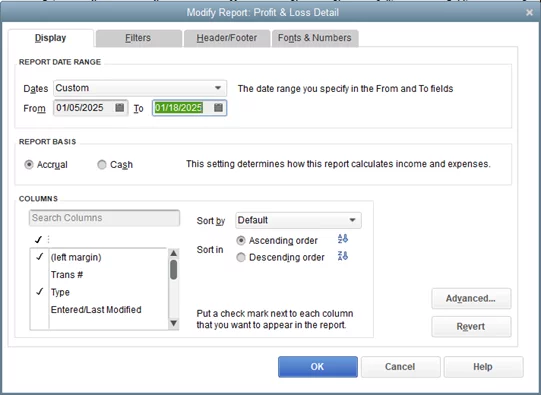
The Modify screen is available in all QuickBooks Desktop reports.
For example, by choosing the Custom option in the Dates field, you can base your activity report only on the last two weeks.
- Filters: The Filters option is where you can really begin to customize your report. Your choice of filters will depend on the report that you wish to customize. The Filters option also lets you choose the account(s) you wish to include in your report. You can choose from blocks of accounts such as all income/expense accounts, or you can drill further down the list and choose specific accounts from your chart of accounts that you wish to include in your report. The filter list is displayed on the right side of the screen and will update as your filter options change.
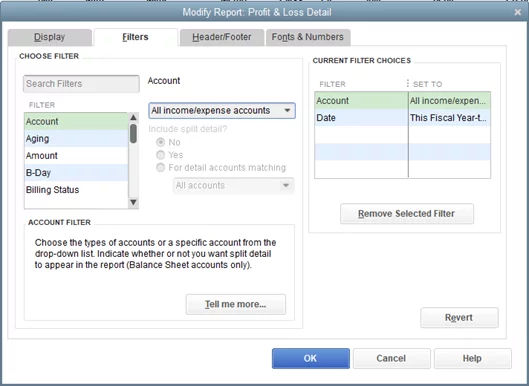
The Filters feature lets you choose the filters to include in your report.
Next, you’ll need to choose the accounts you wish to include. In this example, we’ve chosen all income/expense accounts. But if we decided we only wanted to see only banking information, we could choose those specific accounts.
- Header/Footer: The Header/Footer option is pretty straightforward. This feature lets you choose to include things like your company name, a report title if you wish to include one, the report date, and even a subtitle for your new report. By clicking on the footer tab, you can also include footer detail, such as a page number, or add an extra footer line if you desire. Once you choose your options, the report image on the page will update to display your choices.
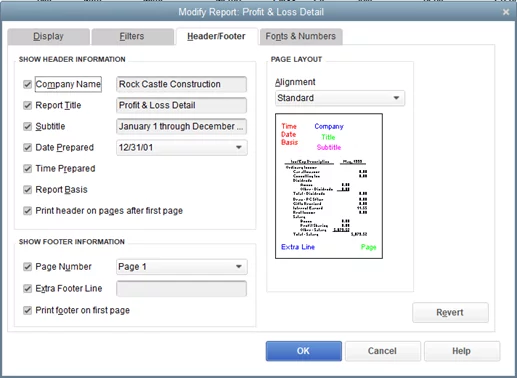
The Header/Footer feature offers a variety of cosmetic options for you to use.
- Fonts & Numbers: You can really make your reports stand out by using the Fonts & Numbers feature in QuickBooks Desktop. This option lets you change the font throughout the report, or only in select areas. For example, you can choose to use one font for your column or row labels and another font for your report data. You can also choose how you wish numbers to appear.
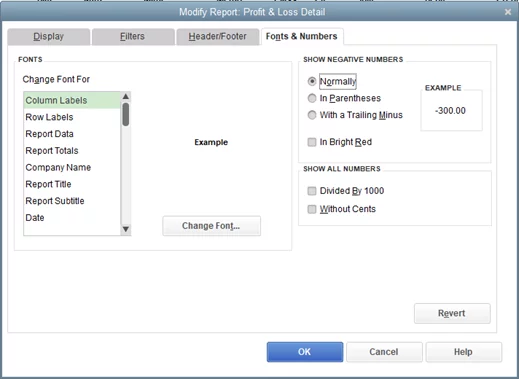
The Fonts & Numbers option lets you easily change the appearance of any report.
For example, the customized profit & loss report displayed below shows data for the first two weeks in January, as we stated above. The report also reflects the custom fonts we chose for this report.
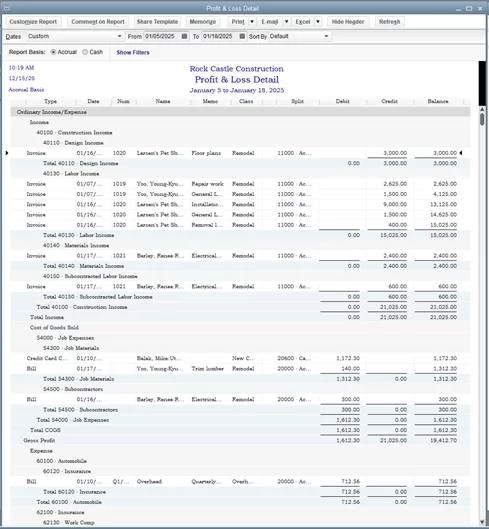
A fully customized profit & loss report.
If you wish to save the custom report for future use, just click on the Memorize Report tab at the top of the screen, and assign the name of the report. You can also add any memorized report to a specific report group if you desire.
QuickBooks Desktop also lets you place a note or comment on any report. For example, if you wish to share your custom profit & loss report with your staff, you can easily share the report via email and add a comment at the bottom of the report.
Five reports you may want to customize
Even though report customization is completed using a standard report template, the customization options are endless. Here are some examples of custom reports you can create for your business.
Sales by State
If you sell products in more than one state, Sales by State is a must. This report allows you to track sales performance in multiple locations, so you’ll always know how a specific state is performing.
To run this report, follow these steps.
- Select the Sales category, and then the Sales by Customer Detail report.
- Click on the Customize Report tab at the top of the screen.
- From the Columns list found under the Display tab, select Name State.
- Select the Total Only option found under the Total By drop-down.
- Under the Sort By option, choose Name State.
- Click on OK, or click on Cancel if you wish to make any changes.
Multiple Year Profit & Loss Comparison
A profit & loss, or income statement is one of the most important reports a business can run. But it can be even more useful when it’s used to compare company performance from one year to the next. The good news is that you can easily print a multiple-year profit & loss statement in QuickBooks Desktop by following these simple steps.
- Select the Company & Financial reports category.
- Select Profit & Loss Standard.
- Click on the Customize tab at the top of the screen.
- On the Display tab, select the years to include in the report.
- Select Year from the Display Column area.
- Click on OK.
Open Purchase Order Report Totaled by Vendor
QuickBooks Desktop’s default Open Purchase Order report does not provide totals by vendor. However, there is a way to obtain these totals by customizing the Transactions Detail report in QuickBooks Desktop. Remember, if you’re using a software application such as PLANERGY, you can also create custom reports directly in the application that may provide a better level of detail for your vendor and accounts payable reports.
To create the Open Purchase Order by Vendor report, follow these steps.
- Select Custom Reports, then Transaction Detail.
- Click on the Customize tab at the top of the screen.
- From the Filters tab, choose the following:
- Account = Purchase Order
- Posting Status = Either
- Received = No
- Select Total by drop-down.
- Select Vendor.
- Click on OK.
This report will provide you with the total amount of purchase orders open by vendor.
Purchase Orders and Sales Orders by Item
If you’re interested in what items are included in your most recent purchase orders and sales orders, you can create a custom report that will provide that detail. To get started, follow these steps.
- Select the Custom Report option, then Transaction Detail.
- Under the Display option, choose the following custom fields:
- Amount
- Balance
- Date
- Name
- Num
- Item
- Qty
- Type
- Under the Total by option, select Item detail.
- Under Filters, select the following filters:
- Detail Level: All except summary
- Item: All Sales Item
- Posting Status: Non-posting
- Transaction Type: Multiple Transaction Types: Sales Orders and Purchase Order.
- When ready to run the report, click on OK.
Outstanding Estimates
If you commonly provide your customers with estimates, a good report to run is the amount of all outstanding estimates. To customize this report to suit your needs, follow these steps.
- From the Reports menu, select Jobs, Time & Mileage.
- Next, select Estimates by Job.
- Click on the Customize Report option at the top of the page.
- Under Display, add the Open Balance
- Uncheck any columns that are not necessary.
- Select the date range of the report.
- Click on OK to process the report.
Once you become familiar with the report customization process, you can easily create custom reports for your business, saving your changes for future access. In addition to creating custom reports in QuickBooks Desktop, you can also export any report to Microsoft Excel for even further customization if desired.
,